This dashboard uses data from both XD and TMC segments. XD data is used for the travel time index (TTI) and can potentially be used for other delay-based metrics. TMC data is being used for reliability metrics on the National Highway System (NHS) and some arterial roads. Reliability metrics include the level of travel time reliability (LOTTR) and the truck travel time reliability (TTTR). This dashboard has been developed to provide our municipal partners with a simple-to-use resource to find high level travel time and congestion information. If more detailed information is needed, please reach out to amccaul@pvpc.org. We will review the request and evaluate how best to assist you with your request.

Overview
CMP Metrics and Formulas
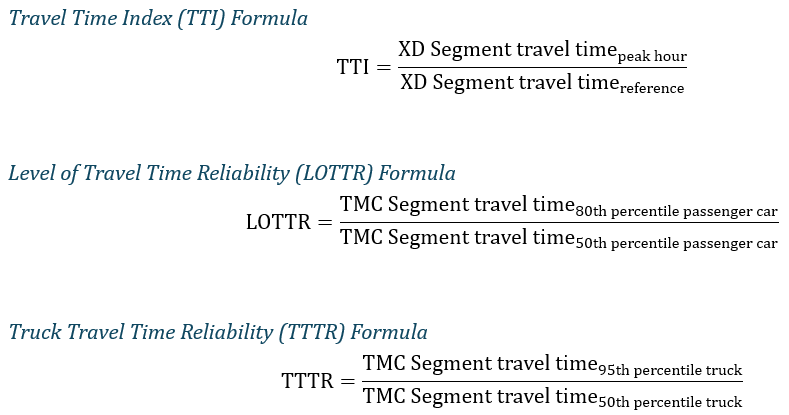
The process of arriving at a travel time index value or level of travel time reliability value was done in multiple steps, using measures along the way. Here are the general formulas used in these dashboards for each metric.
Calculated Measures
Below is a description of all measures used in the visuals on the dashboard pages.
Measures in TMC Passenger Data Table
| Measure | Description of function | Used in |
| Buffer Time (minutes) | Calculates the added time a driver would need to plan for in order to arrive on time 95% of the time | LOTTR: LOTTR by Time of Day (tooltip) |
| LOTTR | Calculates Level of Travel Time Reliability for the selected data | Measure: Weighted LOTTR |
| P50-LOTTR | 50th percentile travel time for selected data | Measure: LOTTR |
| P80-LOTTR | 80th percentile travel time for selected data | Measure: LOTTR |
| P95-TTI | 95th percentile travel time for selected data | Measure: Buffer Time (minutes) |
| Weighted LOTTR | Normalizes LOTTR with consideration for segment mileage so that data makes more sense at different selection levels; otherwise, LOTTR value would only make sense for one single segment | LOTTR: LOTTR by Community, LOTTR: LOTTR by Time of Day, LOTTR: Unreliable Segments |
[P50-LOTTR] and [P80-LOTTR] → [LOTTR] → [Weighted LOTTR]
[P95-TTI] → [Buffer Time (minutes)]
Measures in TMC Truck Data Table
| Measure | Description of function | Used in |
| P50-Per-Mile-Travel-Time | Calculates 50th percentile travel time per mile | TTTR: TTTR Percentiles |
| P50-TTTR | 50th percentile travel time for selected data | Measure: TTTR |
| P95-Per-Mile-Travel-Time | Calculates 95th percentile travel time per mile | TTTR: TTTR Percentiles |
| P95-TTTR | 95th percentile travel time for selected data | Measure: TTTR |
| TTTR | Calculates Truck Travel Time Reliability for the selected data | Measure: Weighted LOTTR |
| Weighted TTTR | Normalizes TTTR with consideration for segment mileage so that data makes more sense at different selection levels; otherwise, TTTR value would only make sense for one single segment | TTTR: TTTR on Interstates by Time of Day, TTTR: TTTR Percentiles, TTTR: Interstates |
[P50-TTTR] and [P95-TTTR] → [TTTR] → [Weighted TTTR]
Measures in XD Data Table
| Measure | Description of function | Used in |
| XD Buffer Time (minutes) | Calculates the added time a driver would need to plan for in order to arrive on time 95% of the time | TTI: Travel Time Index line graph (tooltip) |
| XD P95 | 95th percentile travel time for selected data | Measure: XD Buffer time (minutes) |
| XD Peak Hour Travel Time | Determines the slowest hour of the selected segments | Measure: XD TTI |
| XD Reference Travel Time | Determines the reference travel time of the selected data based on the reference speed and the length of the segment(s), pulled from the identification table | Measure: XD TTI |
| XD Segment Mileage | Sums the mileage of the selected segment(s) | Measure: XD Reference Travel Time |
| XD Speed considering Observ. Counts | Returns the average travel speed of the selected data with consideration for the number of observations in the monthly aggregation (introduced in SQLite consolidation as a new column) | TTI: Vehicle Speed line graph |
| XD Sum of Miles | Sums the miles for the selected data | Measure: XD Speed considering Observ. Counts |
| XD Travel Time considering Observ. Counts | Returns the average travel time of the selected segment(s) with consideration for the number of observations in the monthly aggregation (introduced in SQLite consolidation as a new column) | Measure: XD Travel Time Group by ID |
| XD Travel Time Group By ID | Aggregates the above measure on segment ID so it can be used in final TTI | Measure: XD Speed considering Obserc. Counts |
| XD TTI | Calculates Travel Time Index for the selected data | Measure: XD Weighted TTI |
| XD Weighted TTI | Normalizes TTI with consideration for both segment mileage AND the number of monthly observations (new column created during SQL processing); otherwise, TTI value would only make sense for one single segment | TTI: Travel Time Index line graph, TTI: Travel Time Index matrix; TTI: TTI by Community matrix |
[XD P95] → [XD Buffer Time (minutes)]
[XD Segment Mileage] → [XD Reference Travel Time]
[XD Reference Travel Time] and [XD Peak Hour Travel Time] → [XD TTI] → [XD Weighted TTI]
[XD Travel Time considering Observ. Counts] → [XD Travel Time Group By ID]
[XD Travel Time Group By ID] and [XD Sum of Miles] → [XD Speed considering Observ. Counts]