PVPC staff perform a variety of activities to identify, track, and alleviate congestion in the Pioneer Valley. In the Pioneer Valley Region, the primary source of data used is probe data provided by MassDOT from several different platforms. Congestion Management is divided into multiple activities: Performance Measure (PM3) monitoring, Congestion Managment Process (CMP), Local Congestion Analysis, and Congestion Cause Analysis. Staff also use congestion data to support other Unified Planning Work Program task(s).
All Things Congestion

Overview
Congestion Analysis
The Congestion Analysis page provides a one stop shop for congestion analysis completed in support of the goals laid out in the Unified Planning Work Program (UPWP).
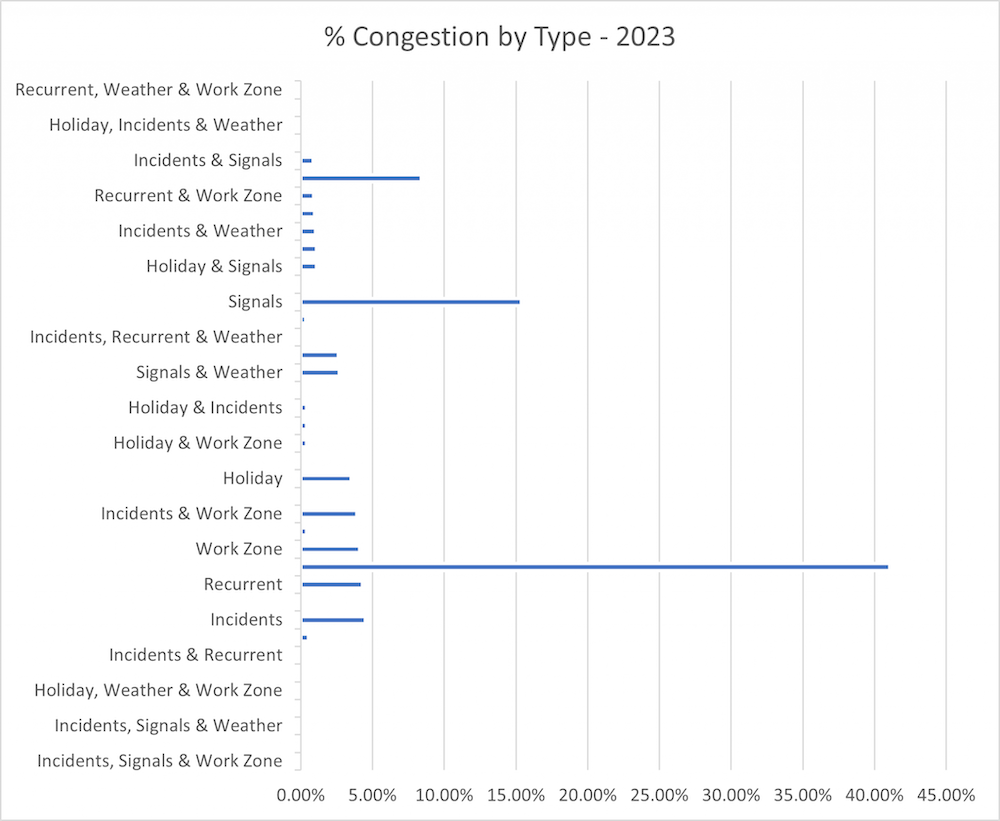
2023 Data
Longmeadow – Route 5 at Bliss Road
Chicopee – Broadway at St. James Ave.
Springfield – Parker Street at Wilbraham Road
2022 Data
2014 Data
Top Bottlenecks
View or Download Top Bottlenecks Data
2022 Data
| Rank | Location | Estimated Volume | Total Delay (M/PY) |
|---|---|---|---|
| 1 | I-91 S @ US-5/EXIT 3 | 49,468 | 25,759,718 |
| 2 | MA-116 N @ I-91 (SPRINGFIELD) | 56,916 | 18,332,211 |
| 3 | I-91 N @ US-5/EXIT 18 | 28,040 | 10,891,050 |
| 4 | I-91 S @ US-5/EXIT 18 | 23,165 | 9,335,934 |
| 5 | ST JAMES AVE N @ BROADWAY ST | 38,041 | 5,766,891 |
| 6 | US-20 W @ NORTH END BRG | 16,472 | 4,836,141 |
| 7 | MA-9 W @ MA-116 | 13,352 | 4,236,402 |
| 8 | I-291 N @ I-90/MASSACHUSETTS TPKE/EXIT 7 | 24,702 | 4,212,494 |
| 9 | LIBERTY ST N @ MAIN ST | 48,492 | 3,741,339 |
| 10 | I-90 W @ US-202/MA-10/EXIT 3 | 24,483 | 3,556,588 |
| 11 | US-5 S @ BLISS RD/EMERSON RD | 15,749 | 3,340,868 |
| 12 | I-91 S @ MA-141/EXIT 17 | 27,500 | 3,319,750 |
| 13 | I-91 N @ US-5/EXIT 3 | 41,582 | 3,160,670 |
| 14 | US-20 W @ MONSON RD | 7,092 | 2,844,433 |
| 15 | WILBRAHAM RD W @ PARKER ST | 10,877 | 2,773,235 |
| 16 | I-90 E @ MA-32/EXIT 8 | 24,627 | 2,692,430 |
| 17 | MA-9 E @ MA-116/S PLEASANT ST | 13,383 | 2,614,060 |
| 18 | US-5 S @ I-91 (NORTHAMPTON) (SOUTH) | 11,564 | 2,580,626 |
| 19 | MA-116 S @ MA-9/COLLEGE ST/S PLEASANT ST | 13,466 | 2,547,563 |
| 20 | MA-9 W @ MA-47/MIDDLE ST | 10,085 | 2,500,169 |
| 21 | US-20 E @ RT-19/N MAIN ST/WALES RD | 6,983 | 2,322,205 |
| 22 | I-91 S @ US-202/EXIT 16 | 21,762 | 2,259,624 |
| 23 | MA-10 S @ MA-141/UNION ST | 7,557 | 2,250,702 |
| 24 | STATE ST E @ MAPLE ST/CHESTNUT ST | 5,125 | 2,207,653 |
| 25 | COOLEY ST S @ ALLEN ST | 15,328 | 2,172,391 |
| 26 | MAIN ST N @ MONARCH PL/HARRISON AVE | 7,503 | 2,158,639 |
| 27 | I-90 E @ HAMPDEN–WORCESTER COUNTY BORDER | 19,995 | 2,135,730 |
| 28 | US-202 N @ POCHASSIC ST | 15,416 | 2,115,457 |
| 29 | MA-33 N @ I-90 | 15,982 | 2,002,130 |
| 30 | MA-21 S @ US-20/BOSTON RD | 18,127 | 1,920,393 |
Data generated using RITIS Bottleneck Rankings tool. Total Delay — Base impact weighted by the difference between free-flow travel time and observed travel time multiplied by the average daily volume (AADT), adjusted by a day-of-the-week factor. This metric should be used to rank and compare the estimated total delay from all vehicles within the bottleneck.